Overview and Key Benefits
Trust staff can use the MAT Dashboard to track the key data for all of their schools who are using Admissions+. It enables you to filter by intake group (so you can compare all nurseries across the Trust, for example) and also tag schools with labels so it is easy to keep track of which schools are using each type of form (for example Year 7, Year 12, In Year etc).
By purchasing the MAT Dashboard, you can save your schools time in their initial setup, too! Your purchase unlocks the function to have your forms cloned - one school in your Trust can then set up their system, and their template can be cloned to all other schools within your Trust.
Linking Schools to your Dashboard and Setting Targets
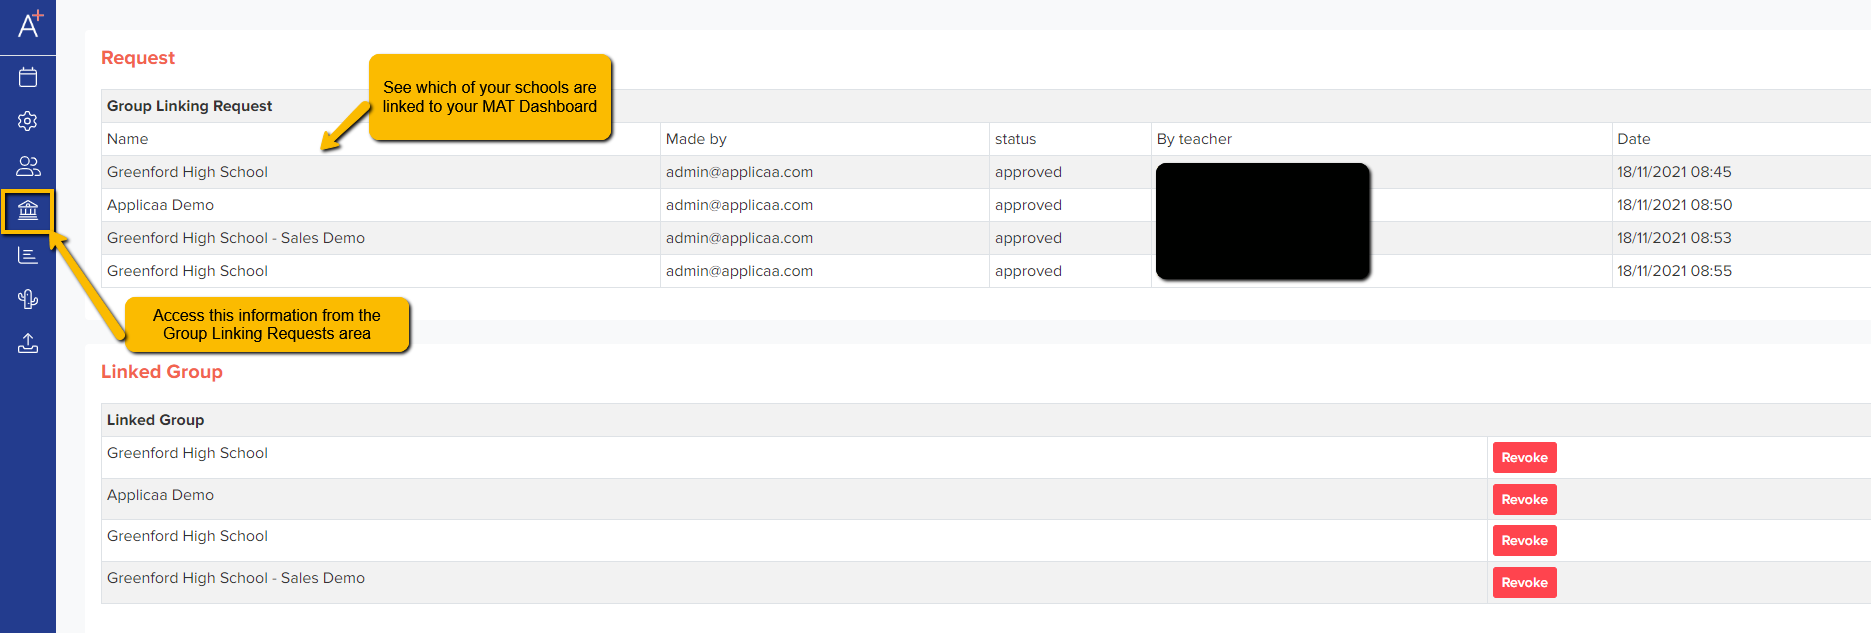
Check to ensure all of your active schools are linked to your MAT Dashboard system by visiting the Group Linking Requests area:
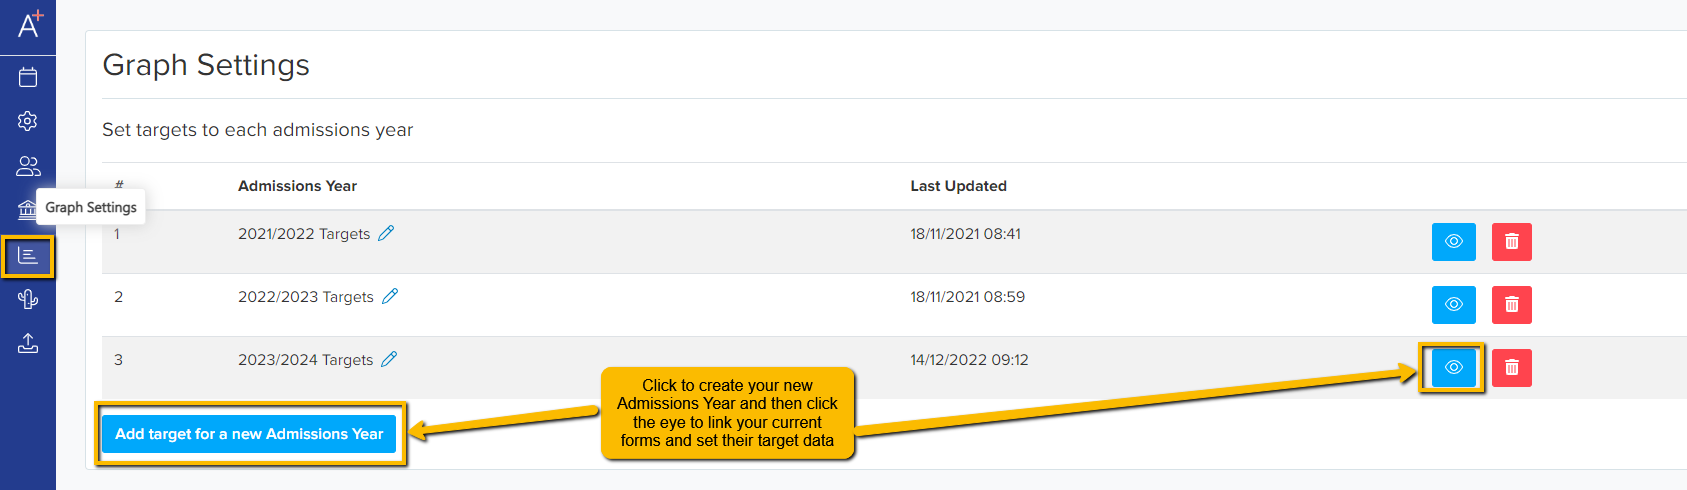
Each year, you will need to click "Graph Settings" to link each school's active forms to your dashboard. You can also add targets for the new admissions year, for various criteria such as number of applications, offers made and number enrolled.
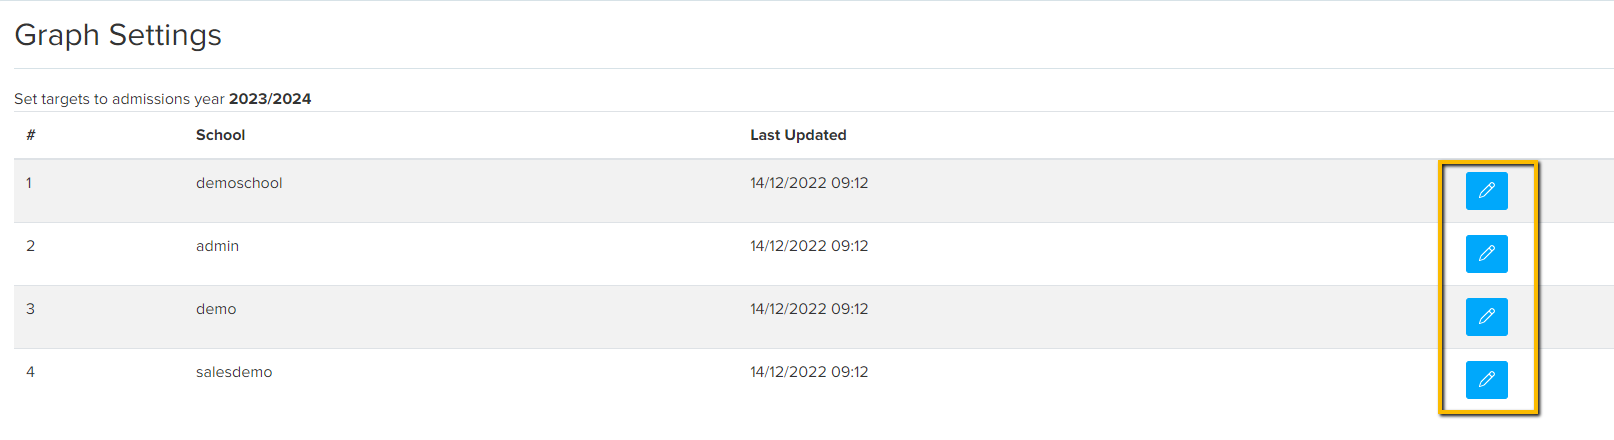
Set your own targets for each school, and each stage of the application process. Click the pencil icon for each school:
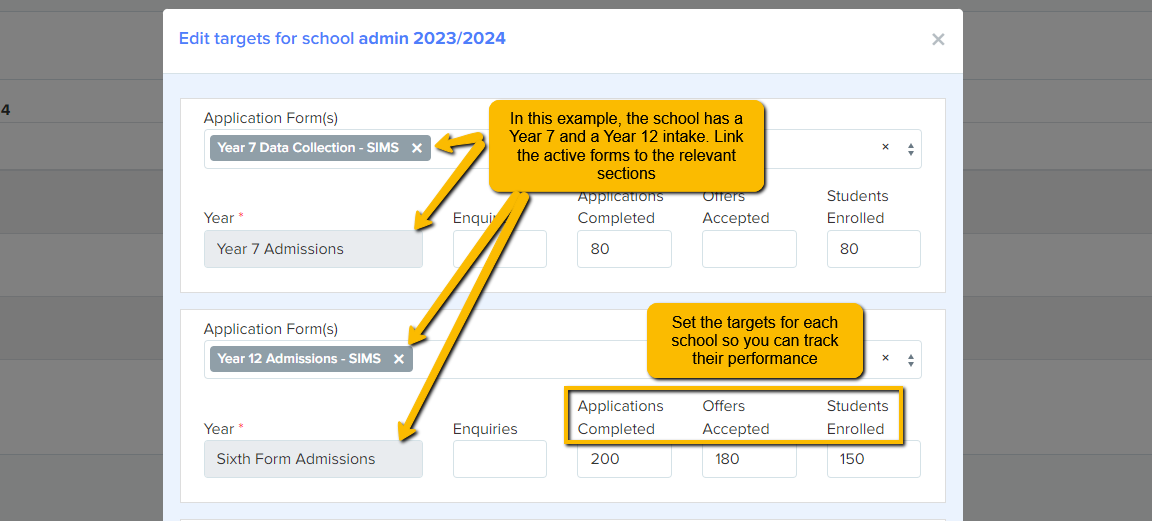
Then select your active forms and assign them to the correct category of admissions, like so:
Filtering your Main Dashboard and Accessing School Systems
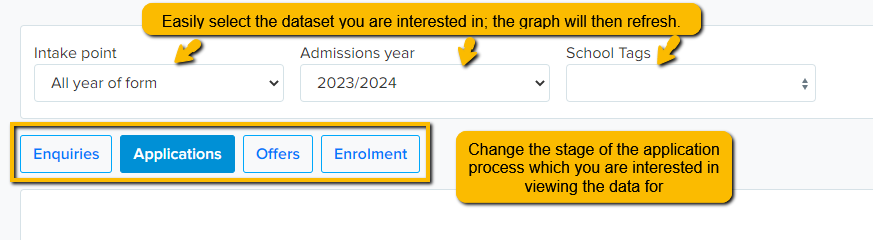
Once you have set your targets, you can change your view on the main dashboard page to show different academic years, different intakes and different stages of the application process. This will help if you have different staff responsible for Primary School and Secondary School figures, for example.
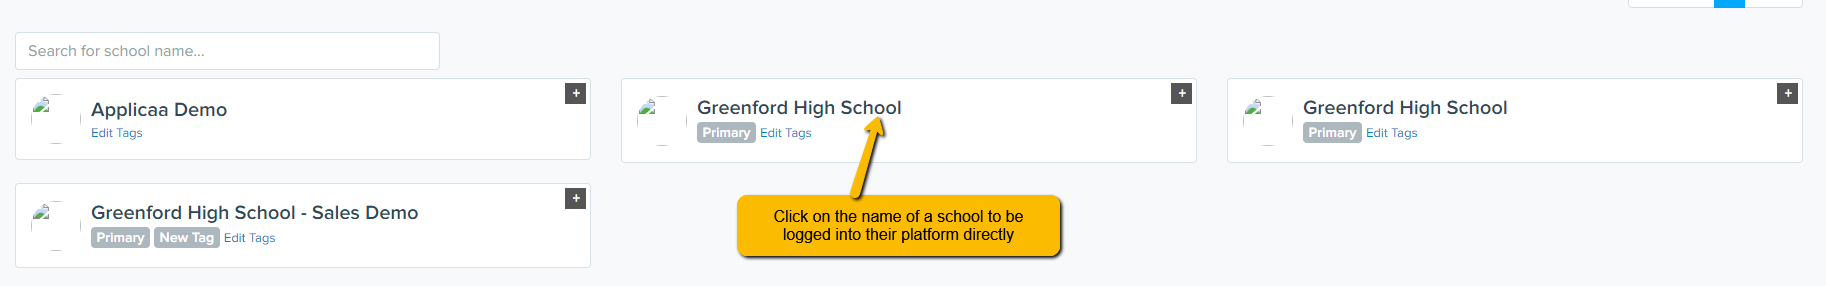
You can view the names of your schools at the bottom of your dashboard and you can click on their names to go directly to the system for that school - no need for you to log in to each platform individually! This will save you time and quickly grant you access to each system from one central location.
Your MAT Dashboard gives you the headline figures, but you may wish to visit each school's site individually to see their data in more depth.
Analysing Your Data
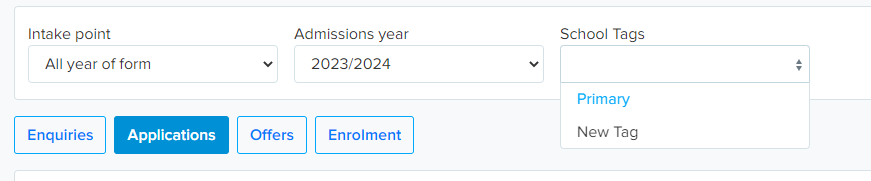
Set tags for each of your schools, so you can use this as part of your filtering. Use the "edit tags" function to add your own tags, or assign the tags you have already created to each of your schools.
This will ensure you can compare "like for like" across your schools - for example, you can see all of the schools tagged with "Year 12" and compare their figures.

The MAT Dashboard uses graphs and tables to show you key data and track your schools against your targets. You set the targets and can adjust these each year to reflect current trends in population.
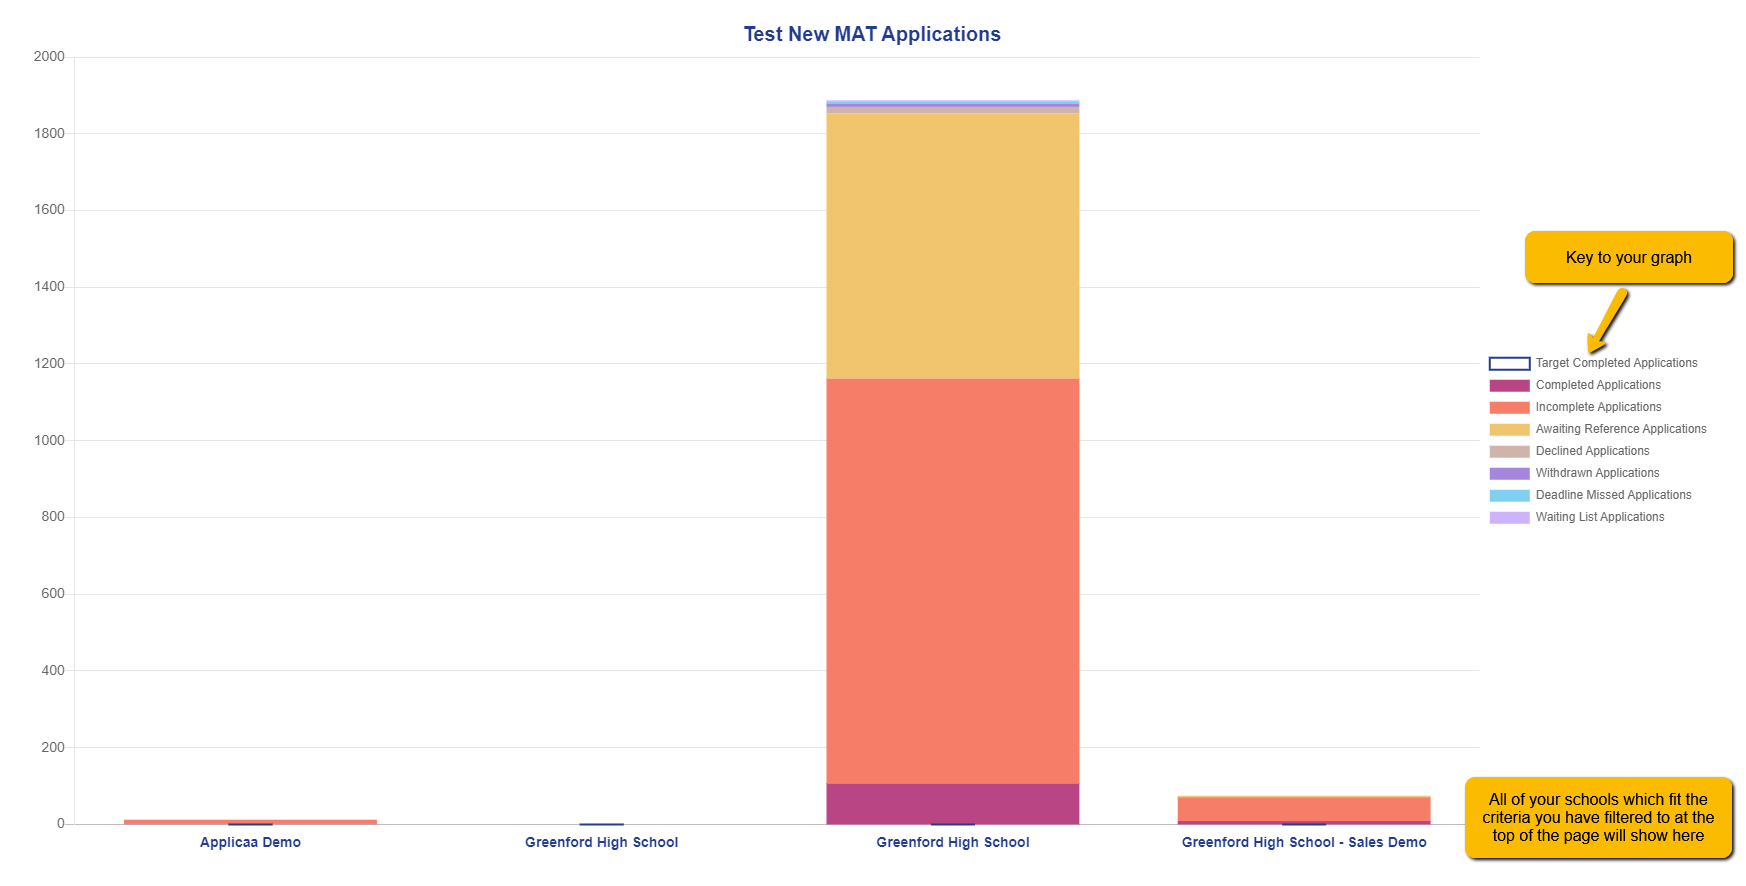
Hover over a bar within the graph to view the information in more detail:

You can also click on any bar within the graph to view the information in more detail. This will open in a separate tab, and will break that school's data down into a subset of the main graph, which will be useful for your detailed analysis and Trust meetings.

For reporting and Trust meetings, you can also export a PDF of the data from your dashboard so you can share this data with key stakeholders, or click the "share" button to generate a link to the platform which you can send to other staff (without needing to give them a login and full access to your MAT Dashboard).

Once you have clicked the "share" button, you can paste the link into an email, for example, and staff can follow the link to be taken directly to your overview.